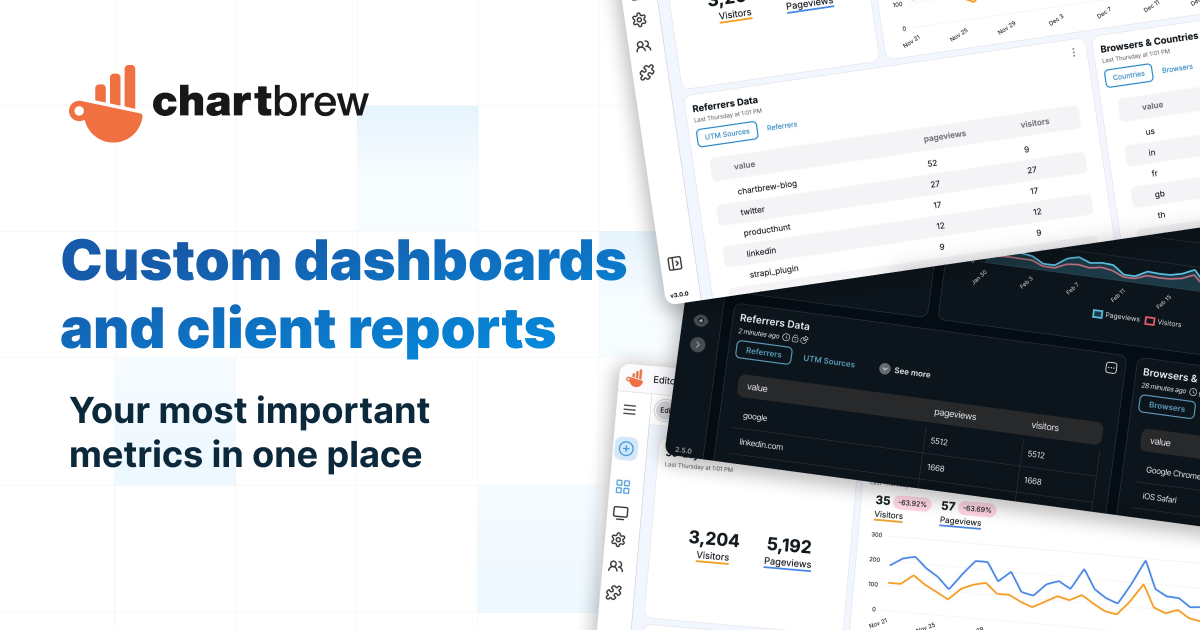
Chartbrew
Connect directly to databases and APIs and use the data to create beautiful charts.
Chartbrew is a self‑hostable web application that connects directly to relational databases such as MySQL and PostgreSQL, as well as to various APIs, allowing users to query data and transform it into live visualisations. The interface includes a chart builder, editable dashboards, and an editor for SQL queries or API requests, enabling the creation of reusable datasets that can be shared across multiple charts.
The tool targets product teams, SaaS companies, and agencies that need to monitor key performance indicators—revenue, sign‑ups, usage, and other metrics—without relying on separate business‑intelligence platforms. It supports embedding charts, scheduling data refreshes, and sending alerts via Slack, email, or webhooks, facilitating both internal reporting and client‑facing dashboards.
Chartbrew is distributed under the MIT license, runs on Node.js with MySQL or PostgreSQL and Redis, and can be deployed via Docker or a one‑click DigitalOcean droplet. Its open‑source nature and free tier make it suitable for teams that prefer to host their own reporting infrastructure.
Reviews
Loading reviews…
Similar apps

Databases & Data Tools
Redash
Connect and query your data sources, build dashboards to visualize data and share them with your company.
Databases & Data Tools
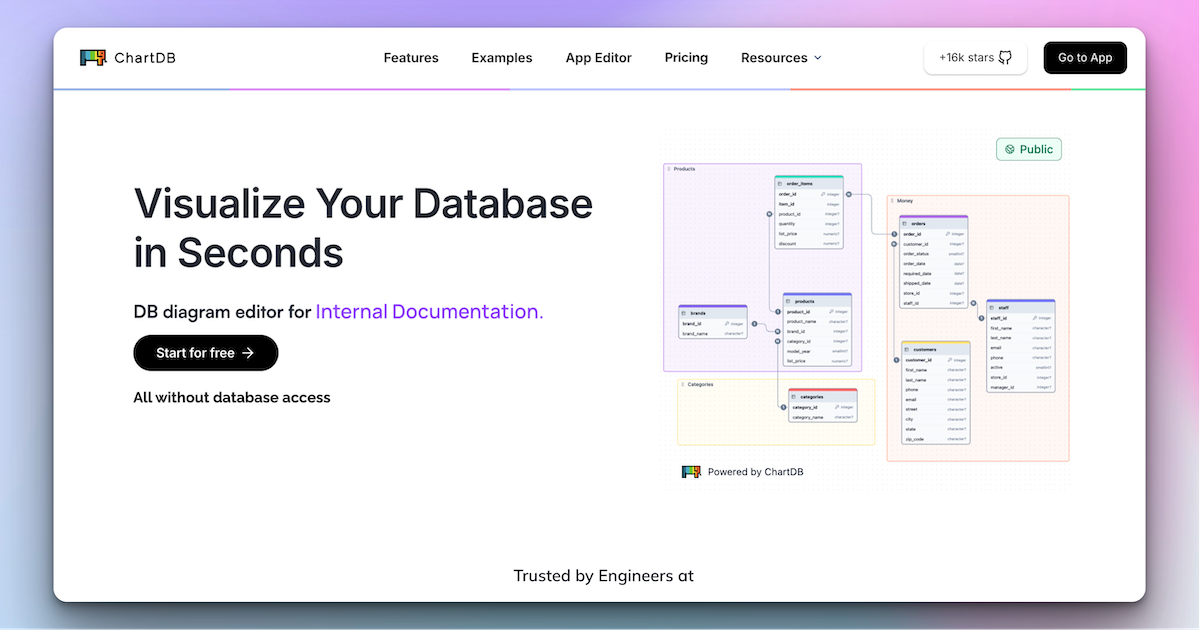
ChartDB
Database diagrams editor that allows you to visualize and design your DB with a single query.
File Management & Transfer
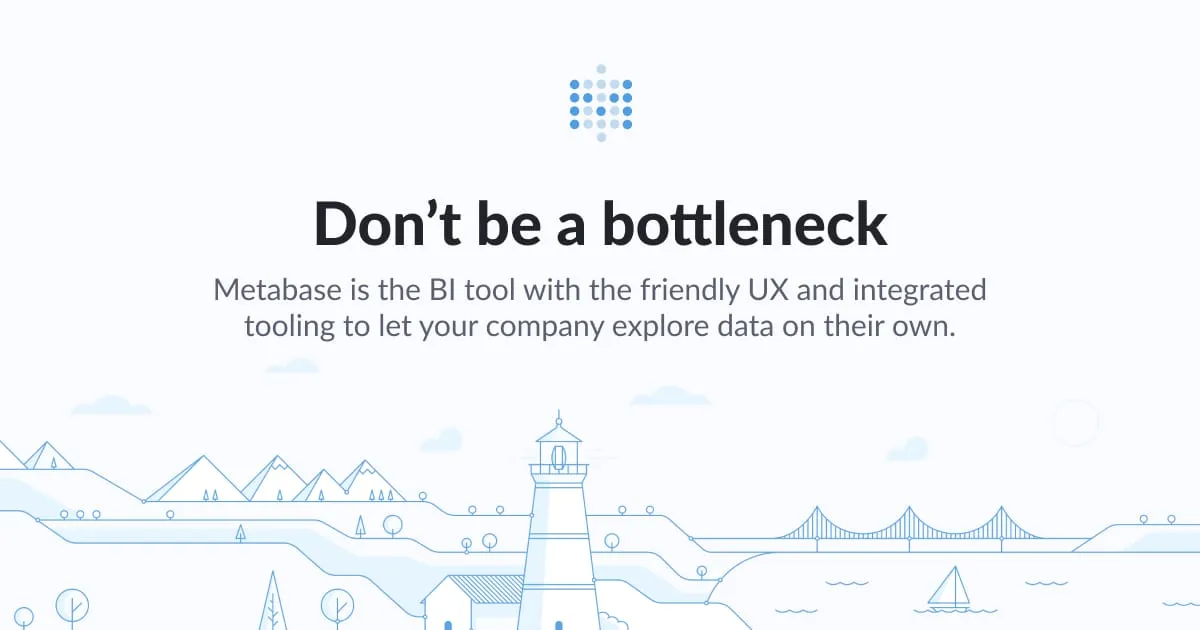
Metabase
Easy way for everyone in your company to ask questions and learn from data.
System Monitoring & Maintenance
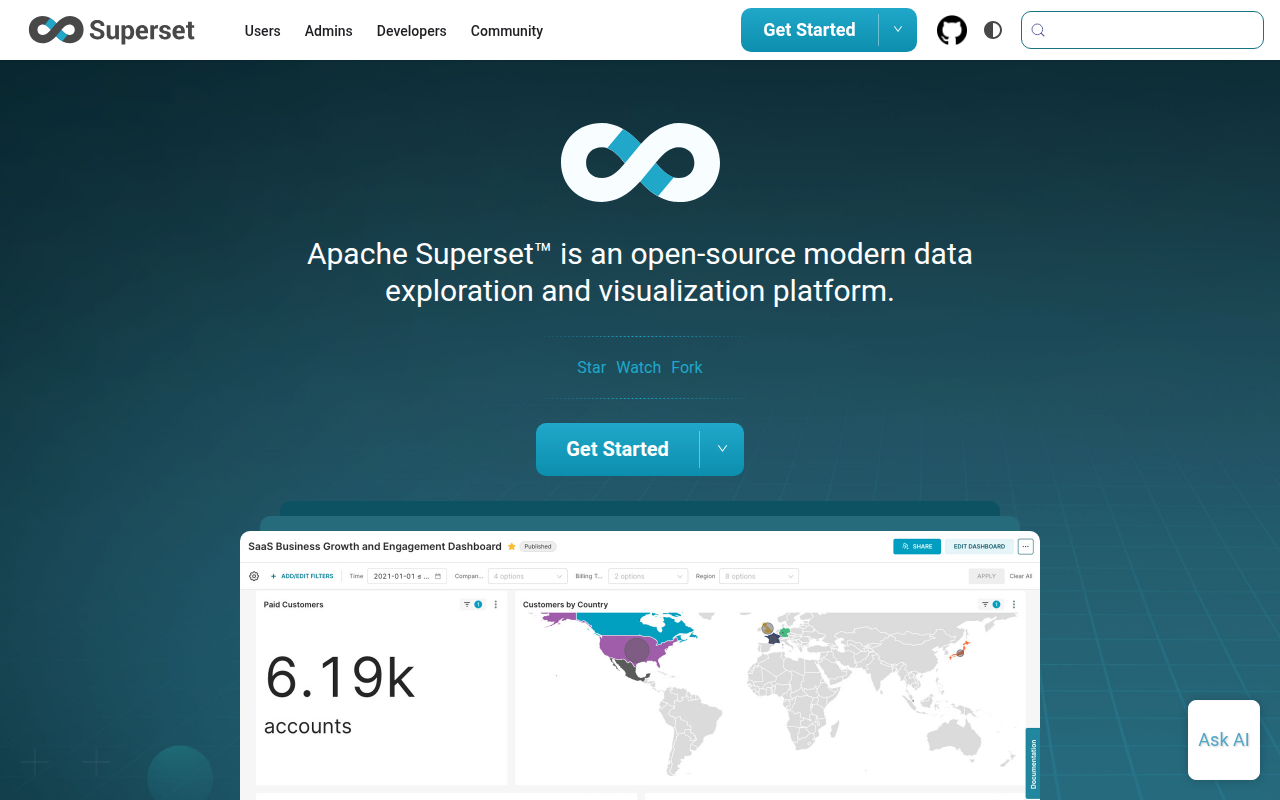
Superset
Modern data exploration and visualization platform.
Databases & Data Tools
Appsmith
Build admin panels, CRUD apps and workflows. Build everything you need, 10x faster.

Databases & Data Tools
MindsDB
AI layer for existing databases that allows you to effortlessly develop, train and deploy state-of-the-art machine learning models using…