Location Risks
Visualize combined risks by location with historical data and interactive maps.
The tool displays a map where multiple risk factors are layered together, drawing on historical records and, when needed, AI‑generated estimates. Users can select districts, adjust a regulatory preference slider, and compare several locations side‑by‑side to see how risk levels shift across the spectrum from low to very high. The interface emphasizes that all data are for informational purposes, sourced from third parties, and may include AI‑derived values that do not constitute official assessments.
It is aimed at individuals or groups who need a visual overview of geographic risk—such as planners, researchers, or analysts—who want to explore how different regulatory scenarios could affect perceived risk. The system provides a disclaimer that users should consult professionals before acting on the information.
Distinctively, the map adapts its presentation based on a user‑defined “worldview” slider, allowing a dynamic view of risk that reflects varying regulatory attitudes, while integrating both historical and AI‑inferred data in a single interactive interface.
Reviews
Loading reviews…
Similar apps
Network & Connectivity
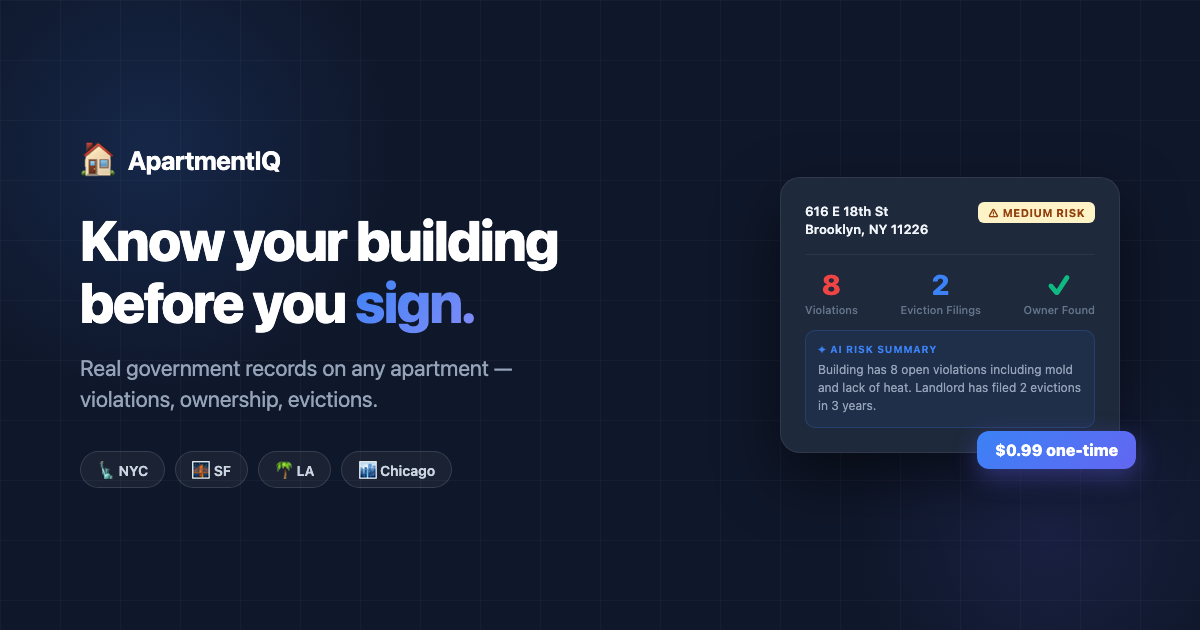
ApartmentIQ
Check any building's violations before you sign a lease

Network & Connectivity
AIRIX
See if ChatGPT, Gemini and Claude are recommending your business. Free scan, 5 seconds, no signup.
Network & Connectivity
Research Rocket
Validate faster. Build smarter.

Network & Connectivity
OnChain360
Track whales, monitor risk across 14,000 assets, follow SEC filings and token unlocks. Your AI analyst Onyx delivers daily briefings.
Databases & Data Tools
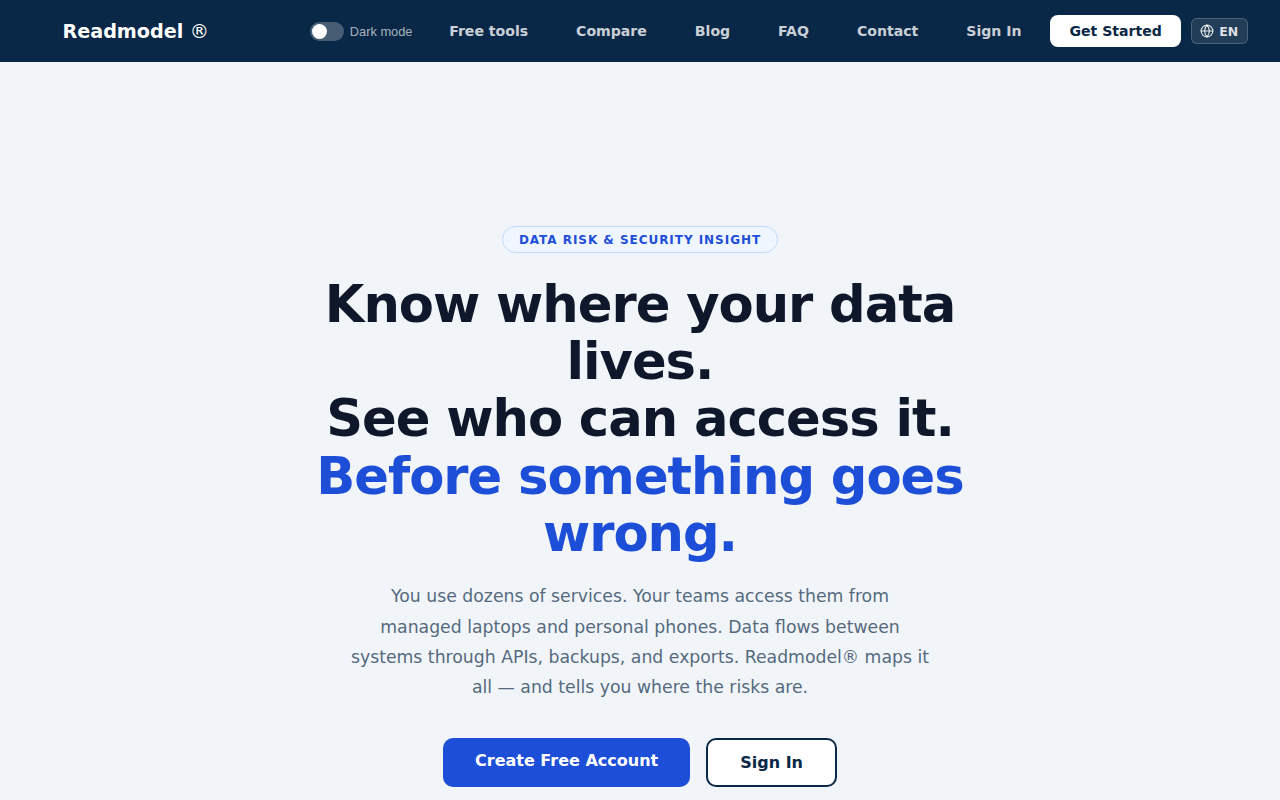
Readmodel®
Know where your data lives. See who can access it.
Network & Connectivity
Google Maps
Web-based mapping service offering directions, traffic, and location search.