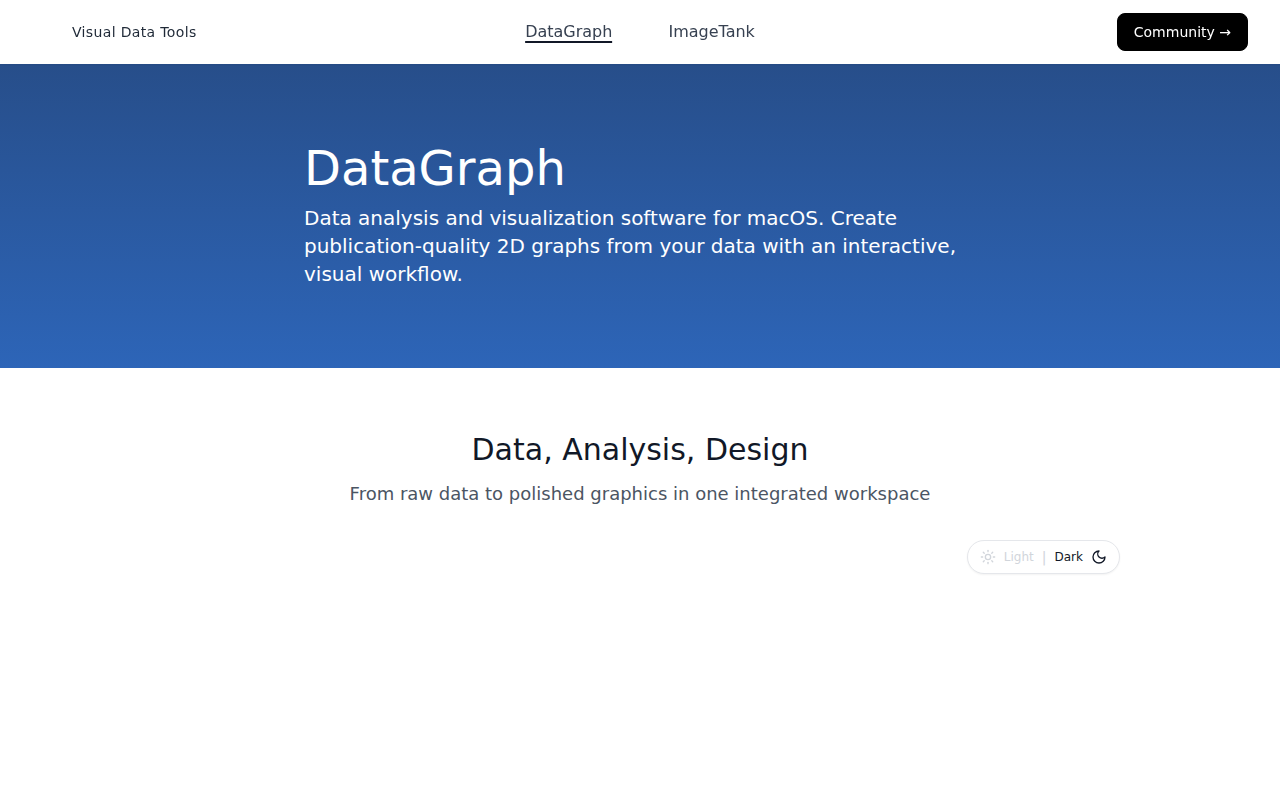
DataGraph
Scientific/statistical graphing software
DataGraph is a macOS‑only application for creating scientific and statistical graphs. It provides tools for importing data, applying mathematical transformations, and generating a wide range of chart types such as line, scatter, bar, and histogram plots. Users can customize axes, labels, legends, and visual styles to produce publication‑ready figures.
The software targets researchers, engineers, and analysts who need precise visual representations of experimental or numerical data. It integrates with typical macOS workflows, allowing data to be copied from spreadsheets or other sources and exported to common image formats for inclusion in reports, presentations, or publications.
What distinguishes DataGraph is its focus on accuracy and flexibility for scientific work, offering fine‑grained control over plot parameters, statistical annotations, and data fitting within a native macOS environment. The product is maintained as a stable, mature offering by Visual Data Tools.
Reviews
Loading reviews…
Similar apps

System Monitoring & Maintenance
WebPlotDigitizer
Extract numerical data from plot images
Databases & Data Tools
LabPlot
Data visualization and analysis software
Code Editors & IDEs
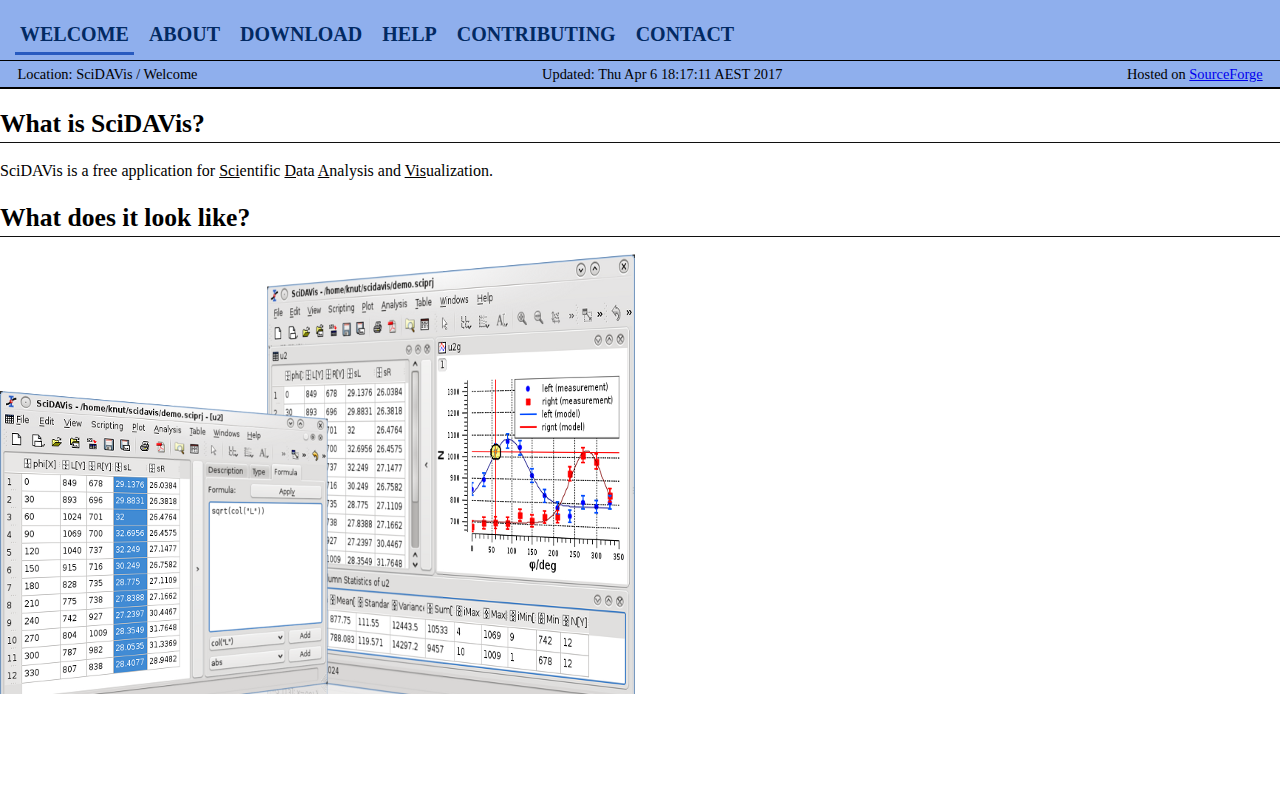
SciDAVis
Application for scientific data analysis and visualization
Clipboard, Input & Automation
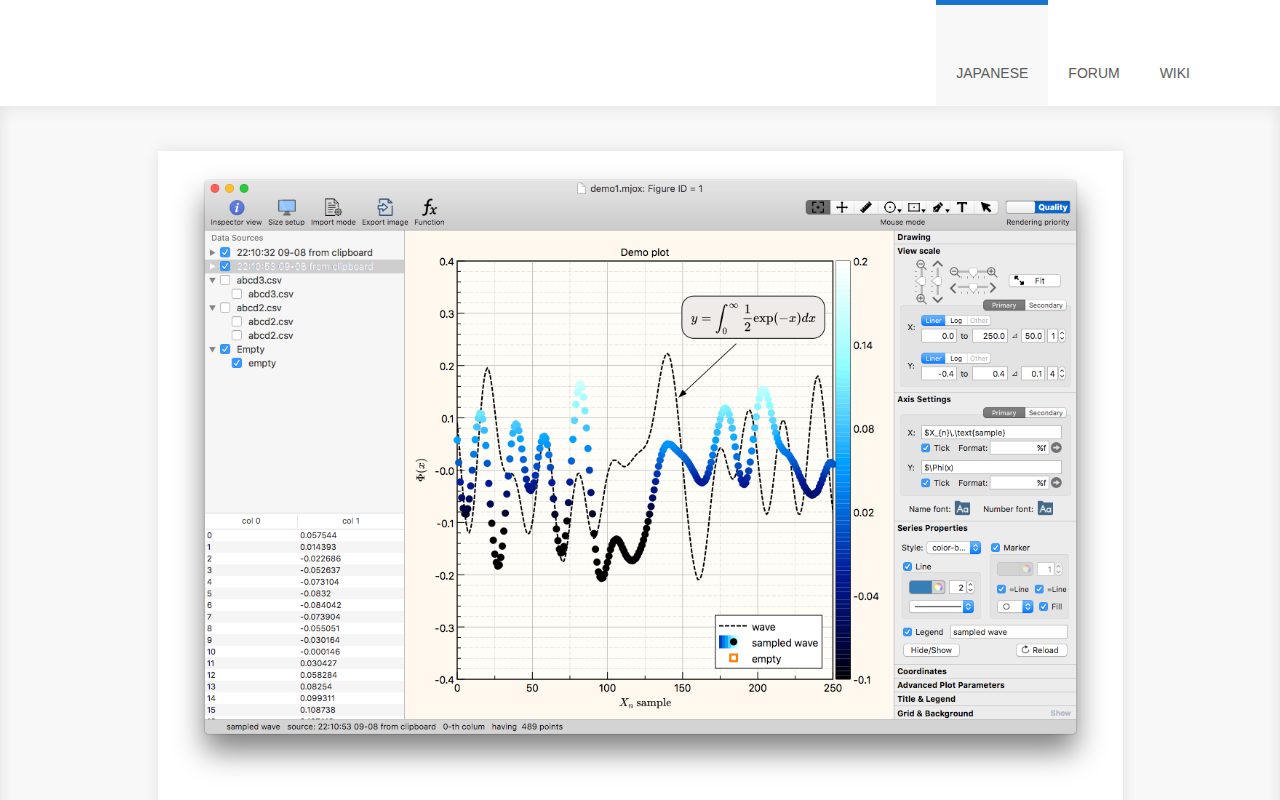
SuperMjograph
Generate scientific graphs from data

Task & Project Management
GraphPad Prism
Statistical analysis and graphing software
Code Editors & IDEs
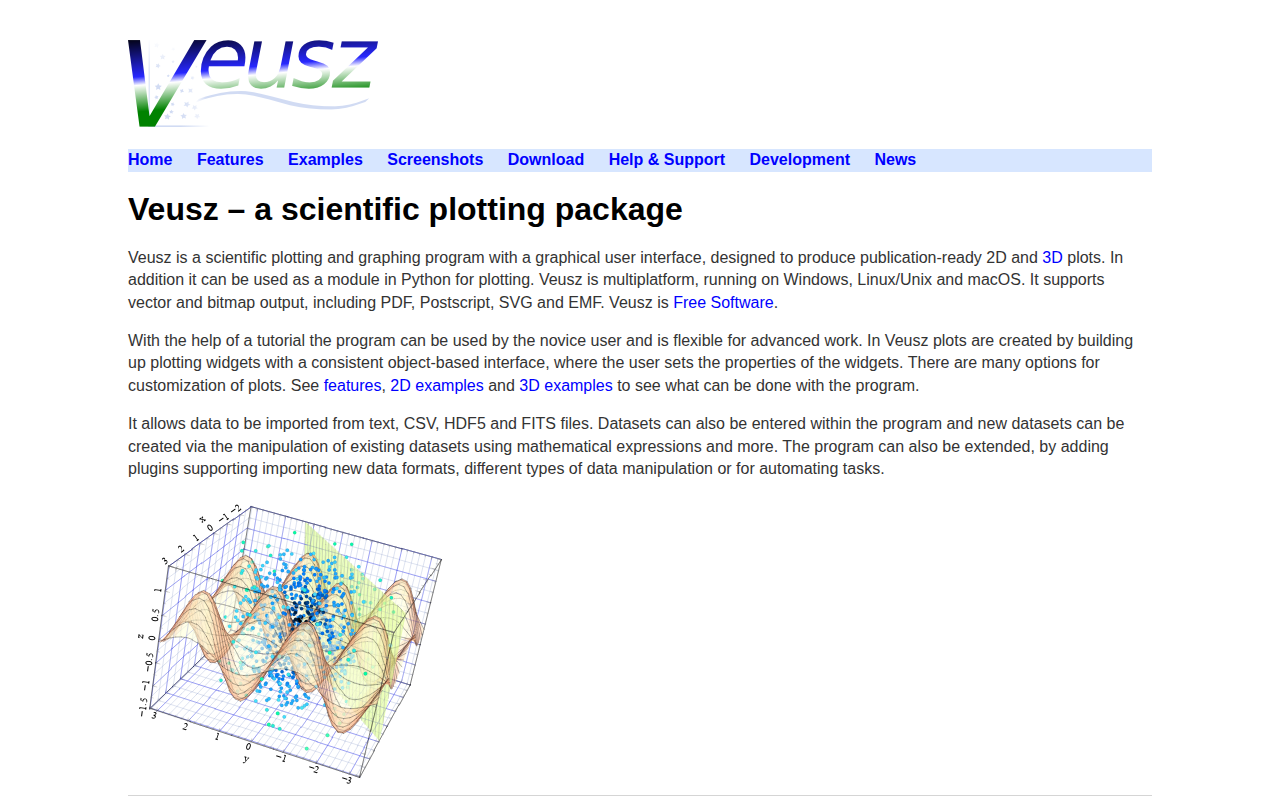
Veusz
Scientific plotting application