Veusz
Scientific plotting application
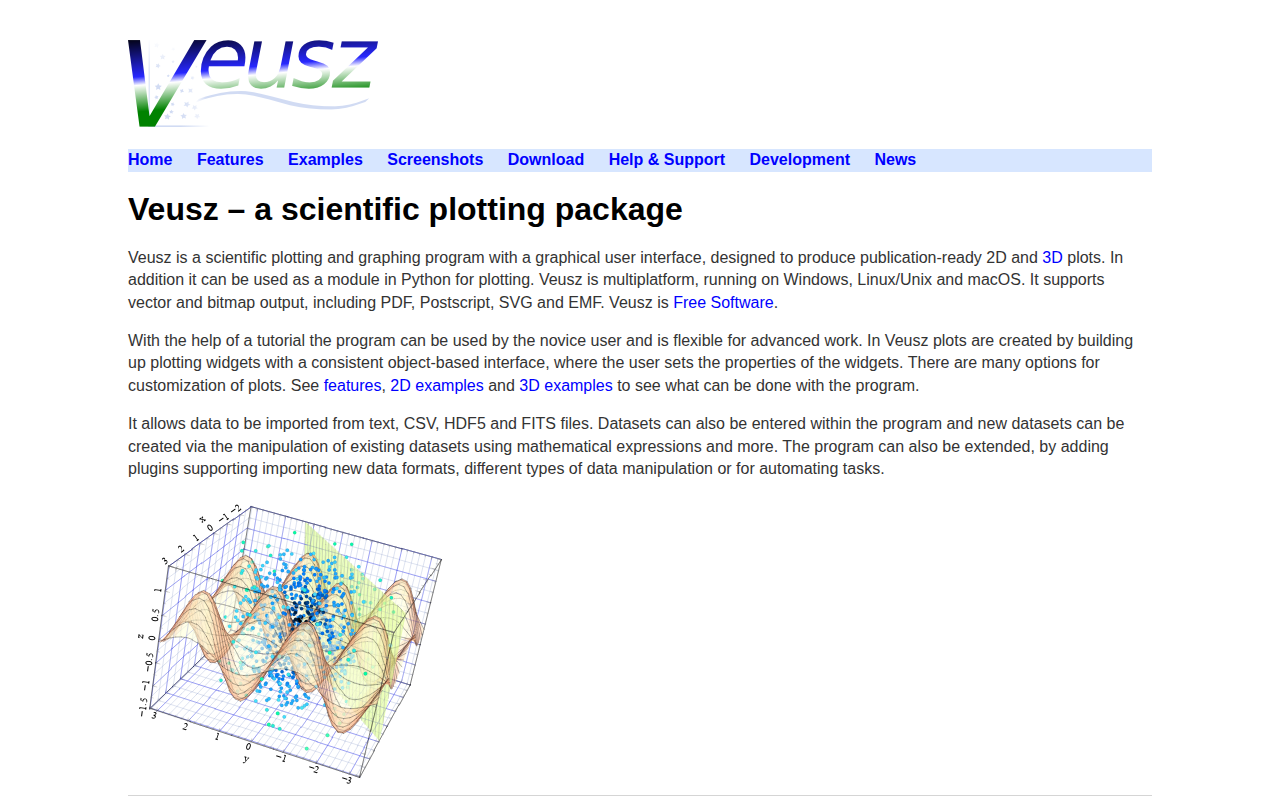
Veusz provides a graphical interface for creating publication‑ready two‑dimensional and three‑dimensional scientific plots. Users assemble plots by adding and configuring a hierarchy of widgets, allowing fine‑grained control over visual properties while keeping the workflow consistent across different plot types. The application can also be invoked as a Python module, enabling script‑based generation of figures.
The program runs on Windows, Linux/Unix and macOS and supports a range of output formats, including vector graphics such as PDF, Postscript, SVG and EMF, as well as bitmap images. Data can be imported from plain text, CSV, HDF5 and FITS files, and users may define or transform datasets within the interface using mathematical expressions. Extensions are possible through plugins that add new importers, manipulation tools or automation capabilities.
Veusz is free software aimed at both novice and experienced users who need flexible, high‑quality scientific visualisation. Its object‑based design, cross‑platform availability and support for both interactive and programmatic use make it suitable for research, teaching and technical publishing.
Reviews
Loading reviews…
Similar apps
Code Editors & IDEs
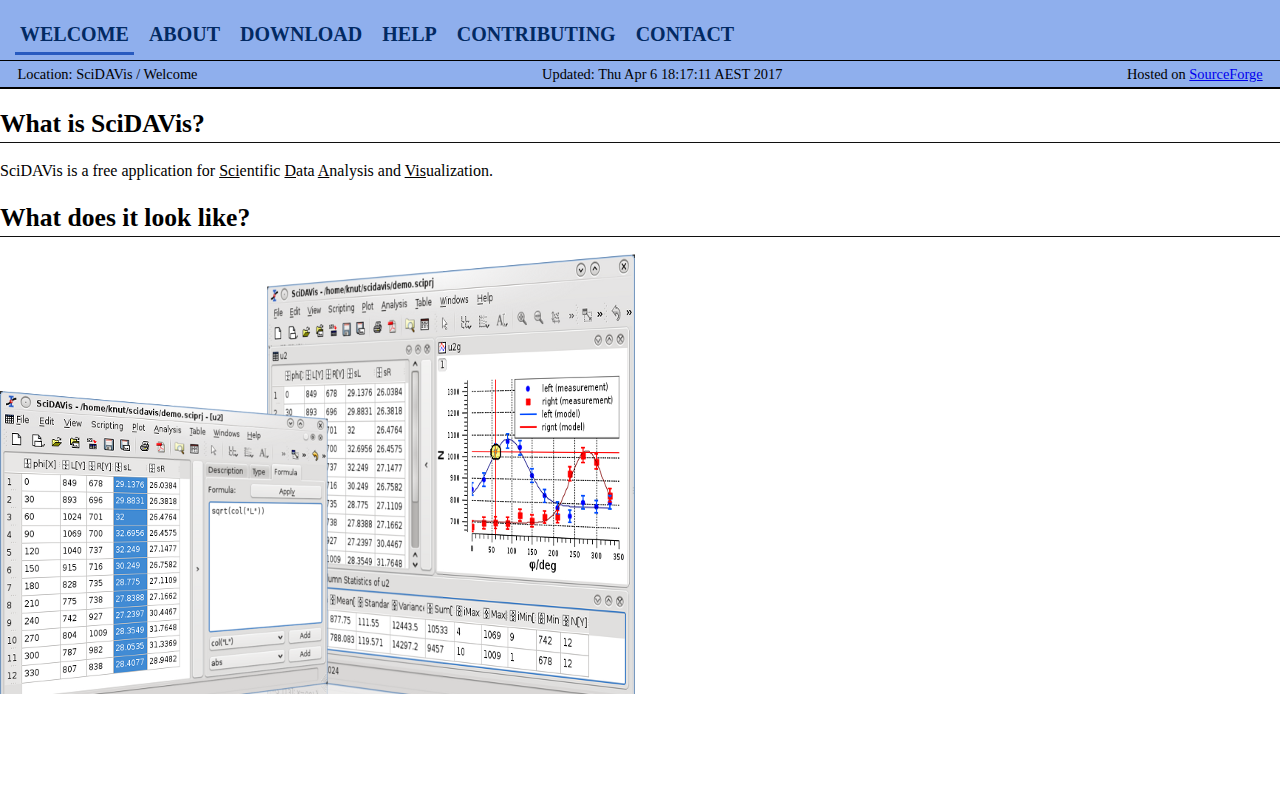
SciDAVis
Application for scientific data analysis and visualization
Databases & Data Tools
LabPlot
Data visualization and analysis software
Code Editors & IDEs
VisIt
Visualisation and data analysis for mesh-based scientific data

Code Editors & IDEs
ParaView
Data analysis and visualization application
Documents, Forms & Contracts
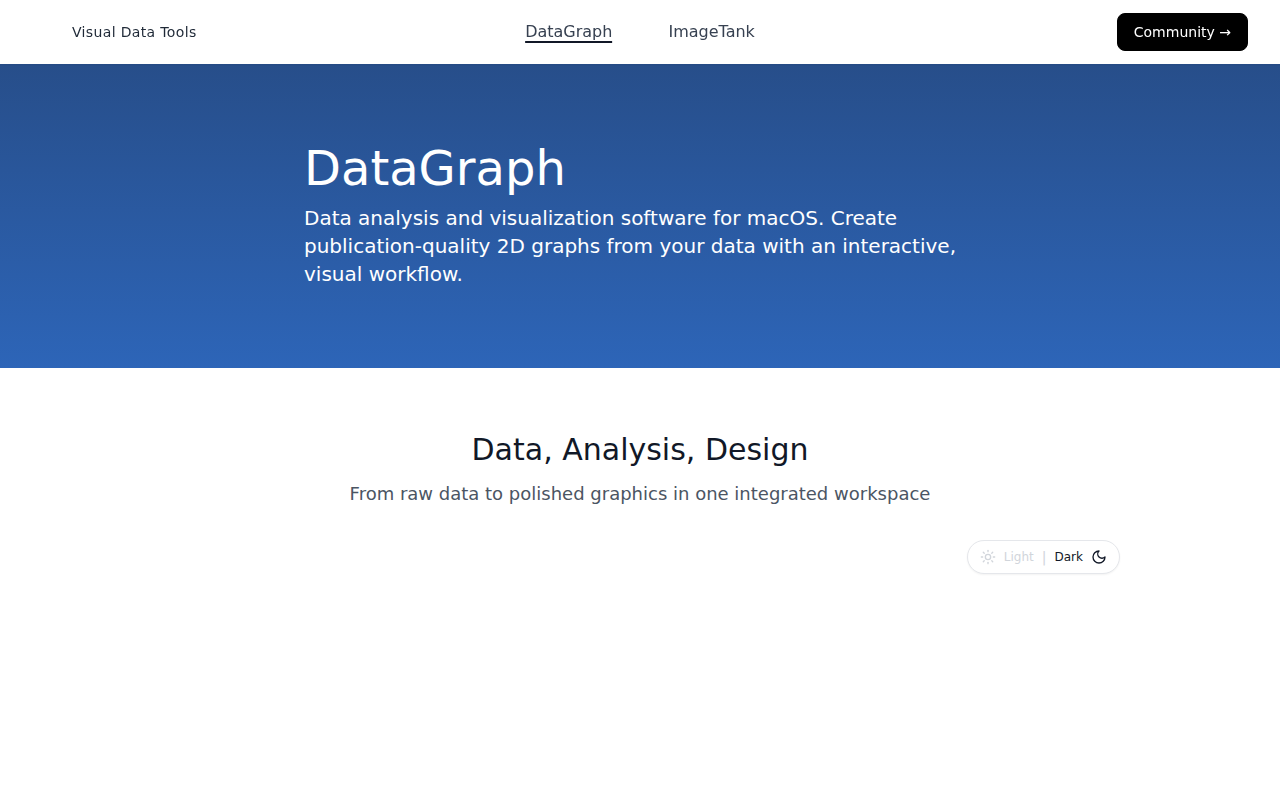
DataGraph
Scientific/statistical graphing software
Code Editors & IDEs
wxMacMolPlt
Cross-platform GUI input generator for GAMESS