gdb-dashboard
Modular visual interface for GDB.
The dashboard is a standalone `.gdbinit` script that uses GDB’s Python API to present a modular visual interface while debugging. When the inferior program stops, the dashboard automatically displays relevant information such as registers, stack, source code, and breakpoints, reducing the need to issue multiple GDB commands manually. All functionality is accessed through the primary `dashboard` command, leaving the original GDB command set unchanged.
Installation consists of copying the `.gdbinit` file to a home directory and optionally installing Pygments for syntax‑highlighted source view. Once set up, developers invoke GDB as usual; the dashboard appears on each stop, allowing them to focus on control flow and program state without repeatedly typing commands.
The tool targets developers who debug native applications with GDB and prefer a concise, information‑rich view of the current execution context. Its modular design lets users enable or disable individual panels, and the project is considered stable and CLI‑available.
Reviews
Loading reviews…
Similar apps

Databases & Data Tools
visidata
Spreadsheet multitool for data discovery and arrangement.
Terminals & CLI
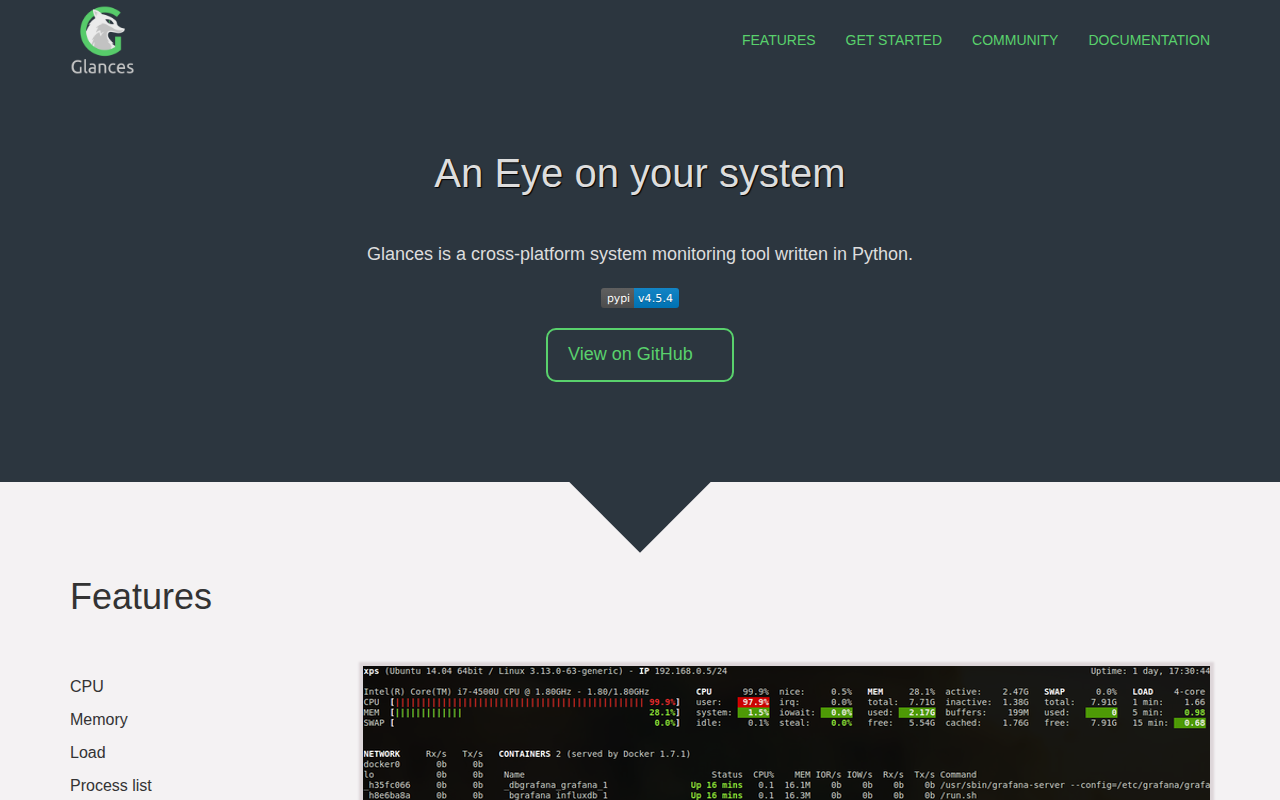
glances
System monitoring tool.
Code Editors & IDEs
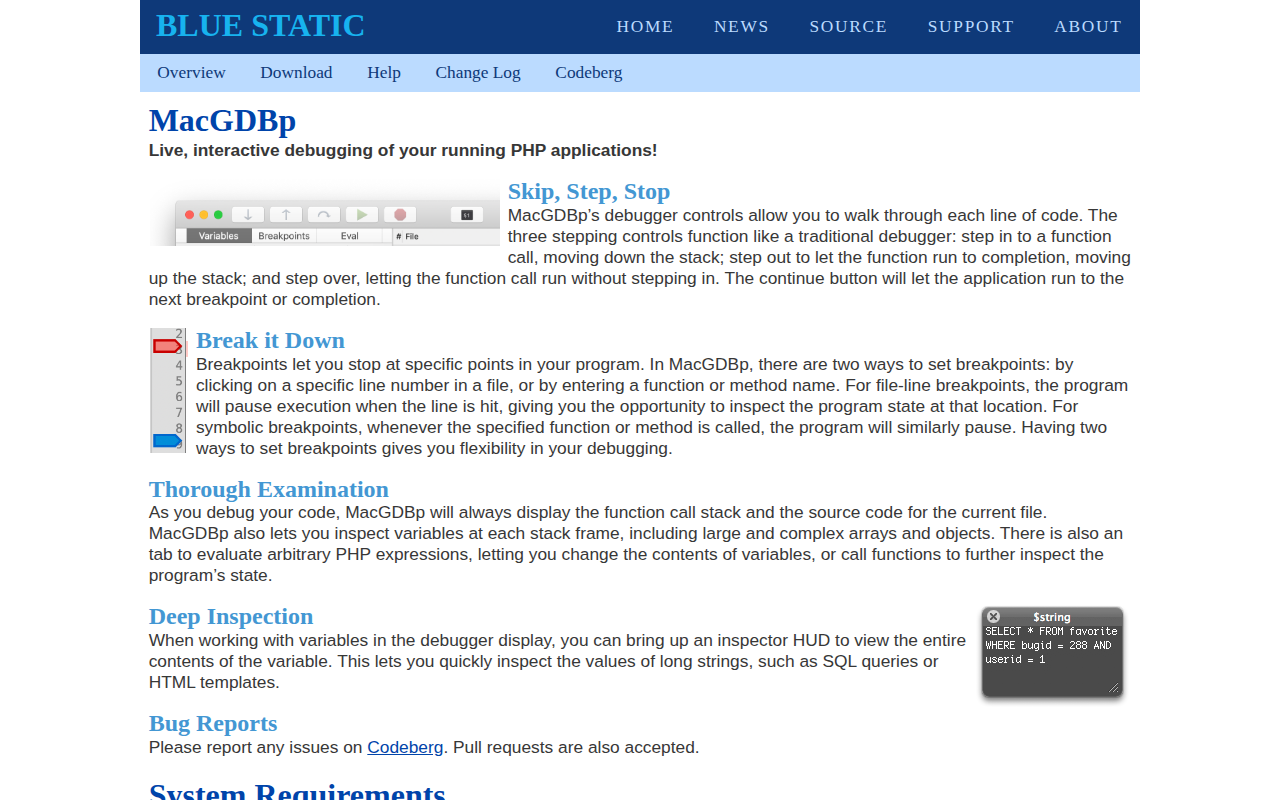
MacGDBp
Live, interactive debugging of your running PHP applications
Version Control & Git
grv
Text-mode interface for git with customisable vi bindings.
Version Control & Git
git commander
Interactive git tool.
Terminals & CLI
rebound
Fetch Stack Overflow results on compiler error.