VisualVM
All-in-One Java Troubleshooting Tool
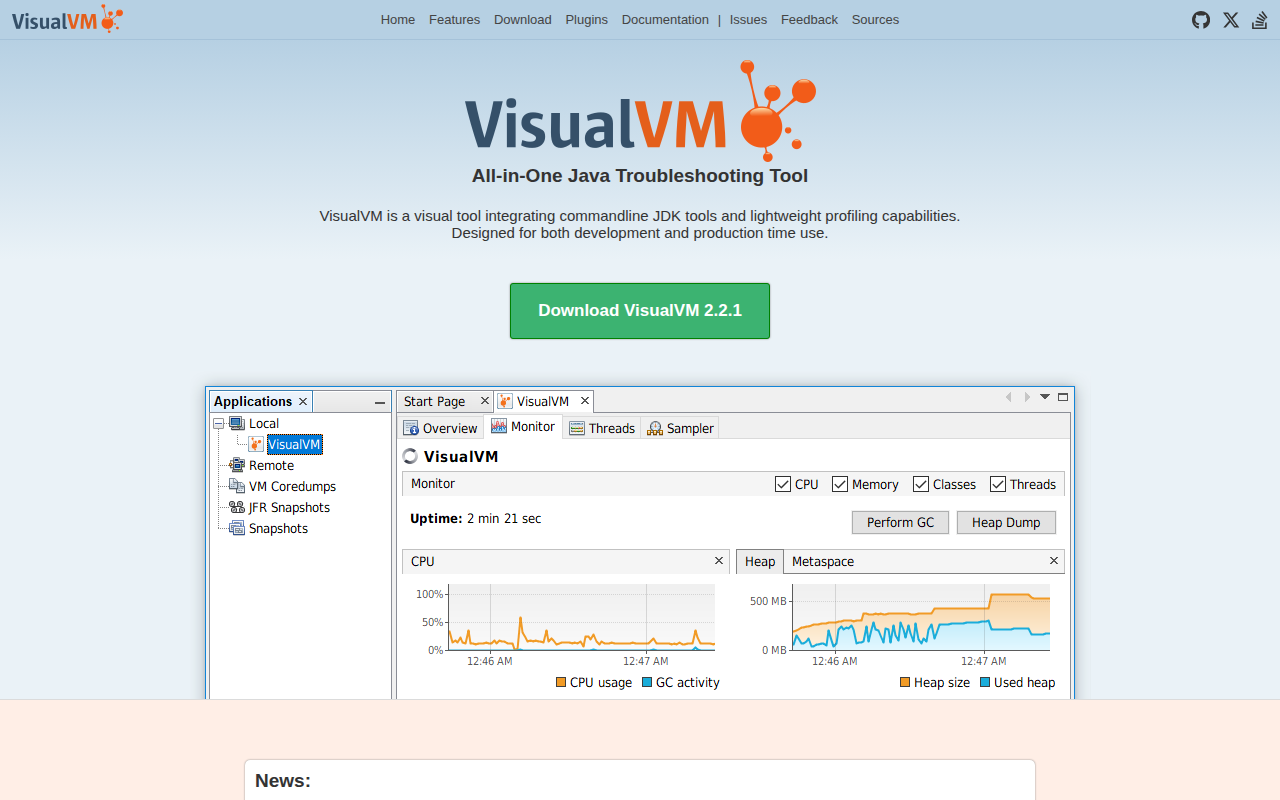
VisualVM combines several command‑line JDK utilities into a single graphical interface, providing lightweight profiling and monitoring capabilities for Java applications. It presents heap, thread, and CPU data in visual form, allowing developers and operators to inspect runtime behavior without switching between separate tools.
The application is intended for use both during development and in production environments, supporting recent JDK releases up to version 25. It includes extensions such as Jolokia connectivity and metrics for virtual threads, and offers an integration that embeds VisualVM functionality inside Visual Studio Code.
Source code is released under an open‑source license, with stable builds available for macOS. Regular updates add compatibility with newer JDK versions and address bugs, while the VS Code extension is marked as stable for everyday use.
Reviews
Loading reviews…
Similar apps

DevOps & Infrastructure
JProfiler
Java profiler

Code Editors & IDEs
GraalVM Java Development Kit
GraalVM from Oracle
Code Editors & IDEs
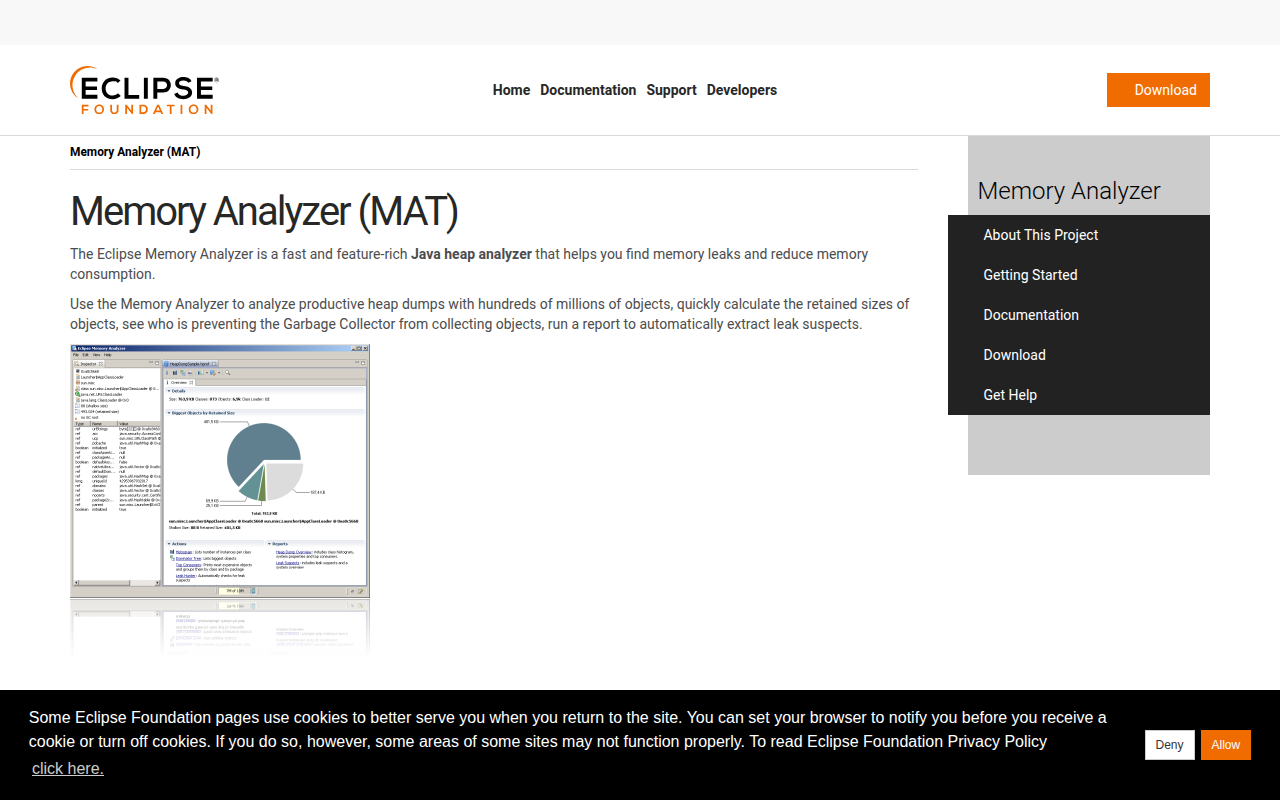
Eclipse Memory Analyzer
Java heap analyzer
Code Editors & IDEs
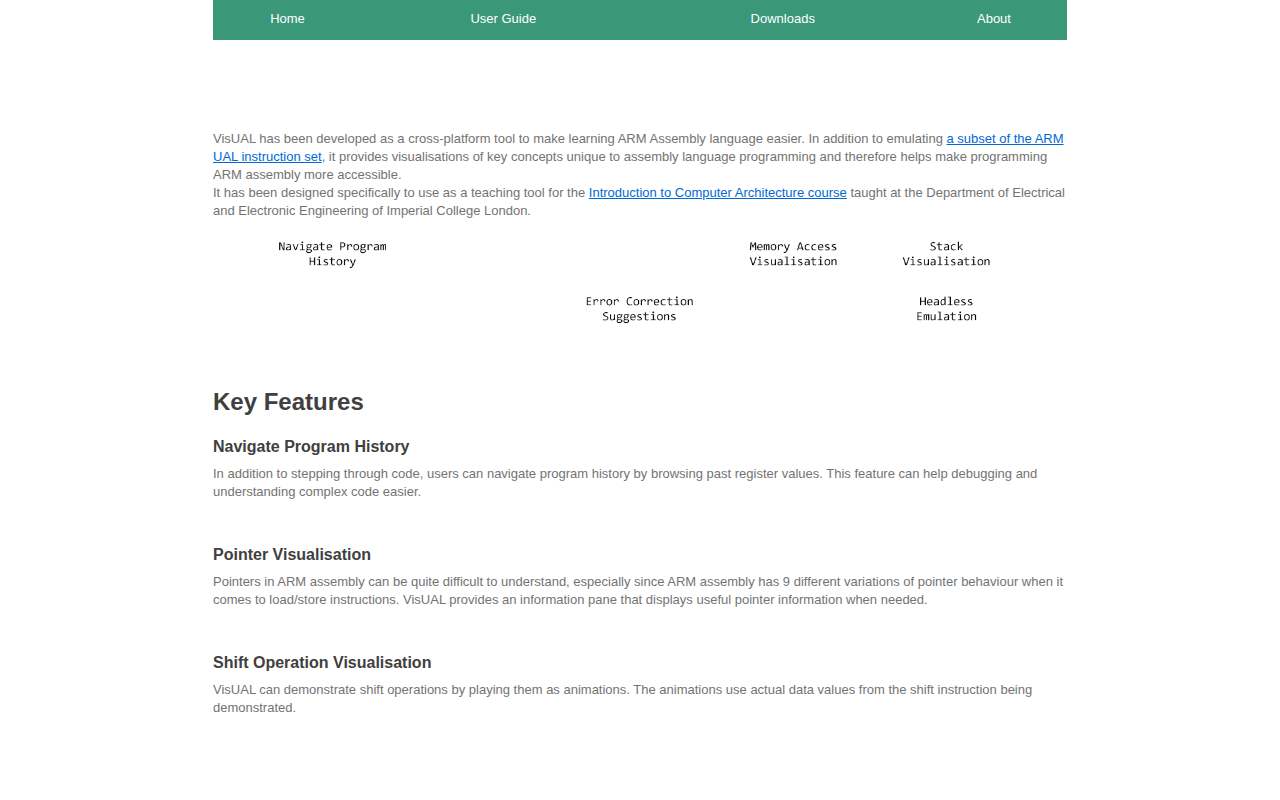
VisUAL
Learn ARM assembly language
DevOps & Infrastructure
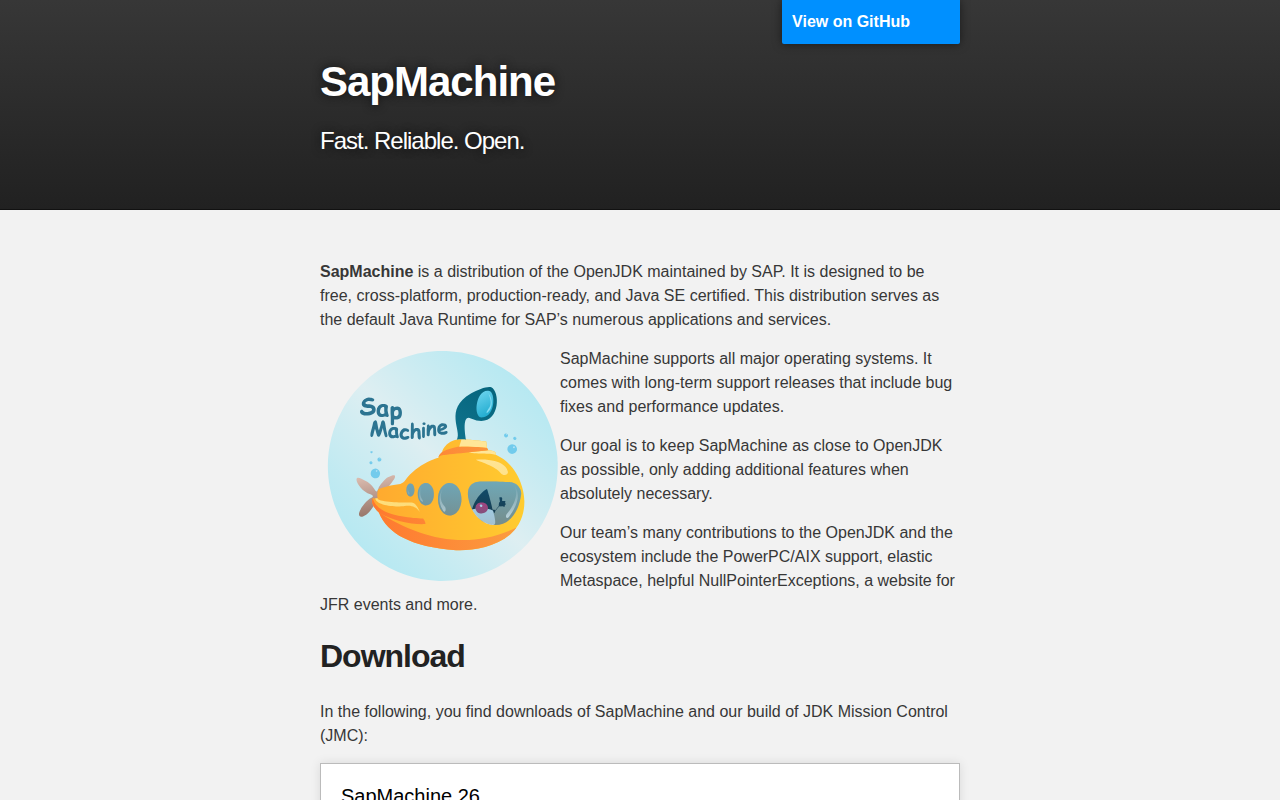
SapMachine OpenJDK Development Kit
OpenJDK distribution from SAP

DevOps & Infrastructure
Azul Zulu Java Standard Edition Development Kit
OpenJDK distribution from Azul